
The differentiation of gold ETF funds has intensified, and the short-short and long-term pattern has been further confirmed.
- 2026-07-09
- Posted by: CD Markets
- Category: financial news

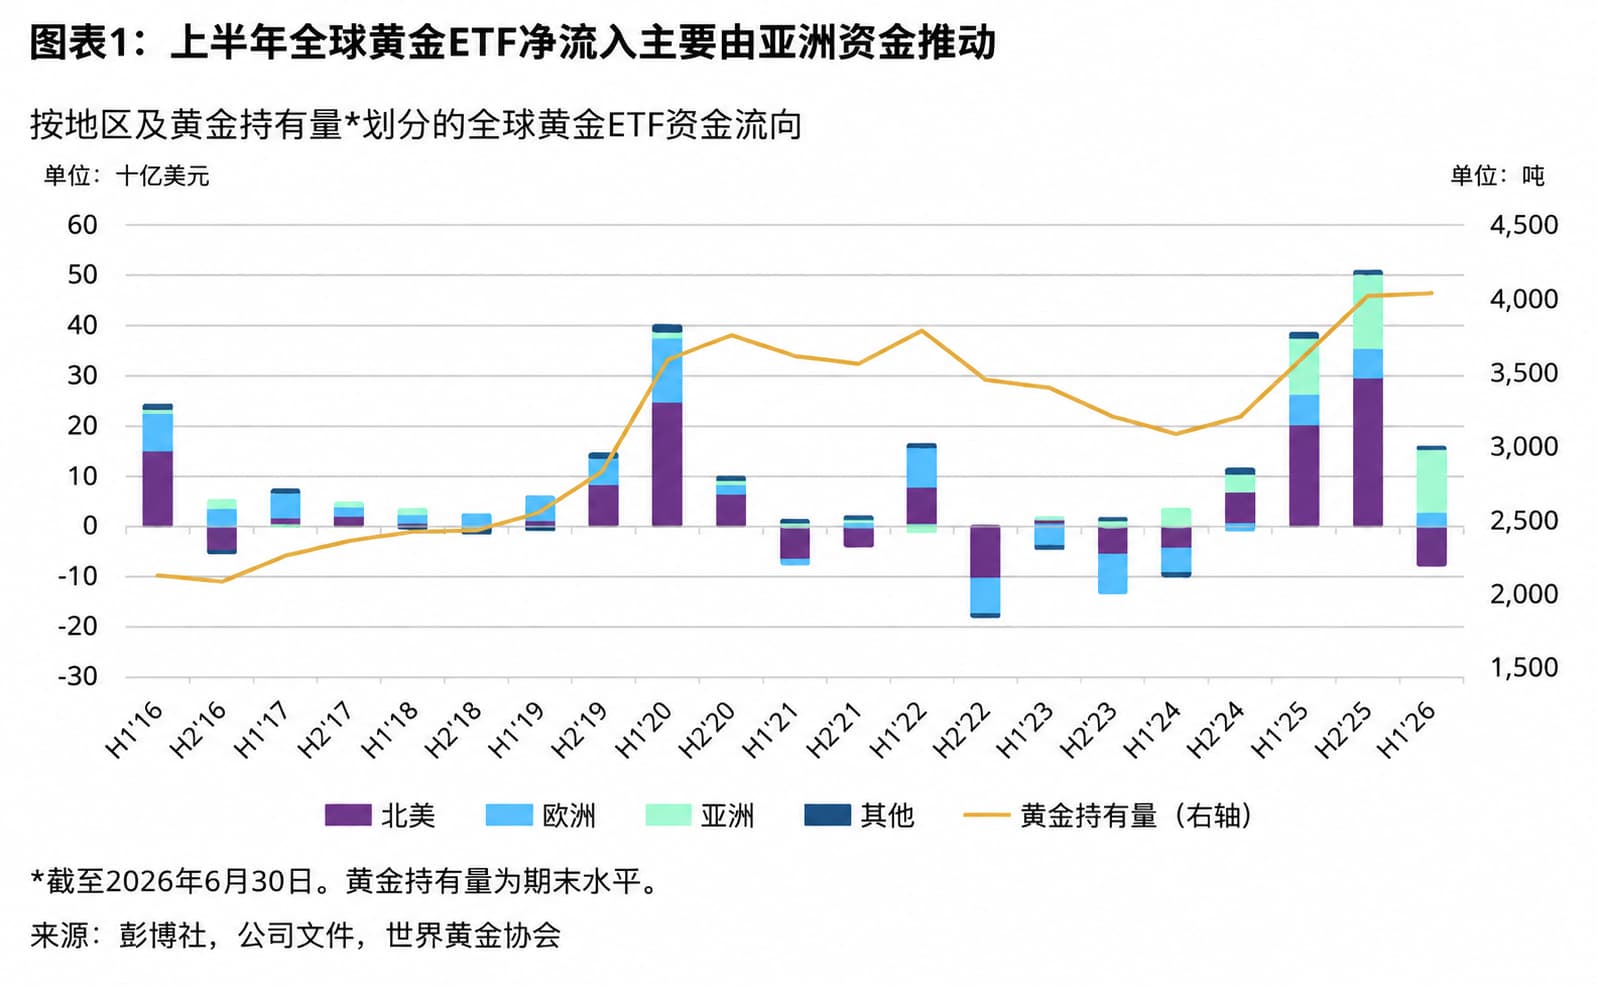
The CD Markets precious metals research team combines the latest June global gold ETF report released by the World Gold Council, the adjustment of gold price forecasts of mainstream institutions and the latest market conditions, and relies on the self-built global gold capital flow monitoring framework and position structure analysis system to deeply dissect the capital characteristics and trend logic of the current gold market, and study and judge the short, medium and long-term market trends. Global gold ETFs continued their capital outflow trend in June, with net outflows reaching US$8.9 billion across the market. Due to the dual impact of gold price corrections and fund redemptions, global gold ETF assets under management fell 13% month-on-month to US$526 billion, and total holdings decreased by 74 tons to 4,047 tons.
CD Markets dismantled the capital flow by region and found that this outflow showed the characteristics of a general decline across the region, with net redemptions occurring in all major regions. Among them, North America ranked first, with an outflow of US$5.5 billion in a single month, accounting for more than 60% of the total global outflow. The core driver was the hawkish policy signal released by the new Federal Reserve Chairman Warsh. The superimposed conflict between the United States and Iran increased concerns about inflation. Market expectations for interest rate hikes continued to rise. Real interest rates rose in tandem with the U.S. dollar, which significantly increased the opportunity cost of holding gold and pushed investors to reduce their positions in stages. There was an outflow of US$818 million from the European region in June. In addition to the correction in gold prices, the European Central Bank's 25 basis point interest rate hike in June (the first rate hike since September 2023) weakened the attractiveness of gold allocation. On top of this, Swiss-listed foreign exchange hedging ETFs continued to experience redemptions and the local currency depreciated against the US dollar, further amplifying the pressure of capital outflows.
It is noteworthy that the Asian market, which performed the strongest in the first half of the year, unexpectedly recorded an outflow of US$2.3 billion in June, setting a record for the largest single-month outflow in history. CD Markets broke down the internal structure of Asia and found that Chinese gold funds are the main source of outflows. The recent recovery in the domestic stock market coupled with the correction of gold prices has led to a recovery in market risk appetite, and some funds have shifted from gold to the equity market. Japanese funds have also experienced outflows, and the Bank of Japan's interest rate hikes have increased the cost of gold holdings. Only Indian funds have continued net inflows. Local investors generally regard gold price adjustments as a window for bargain hunting, reflecting the significant differences in gold allocation logic among investors in different regions.
Despite large outflows in June, global gold ETFs still maintained overall net inflows in the first half of the year, with cumulative net inflows reaching US$8 billion, and total holdings increasing by 18 tons from the beginning of the year. In terms of regions, Asia was still the largest contributor to capital inflows in the first half of the year, attracting a total of US$12 billion in funds, the best first half performance on record; Europe had a cumulative net inflow of US$3.2 billion; North America was the only major region to experience a cumulative net outflow, with a cumulative outflow of US$7.7 billion in the first half of the year, the worst first half performance since 2013. Affected by the fall in gold prices in the first half of the year, the global gold ETF asset management scale still fell by 6% from the beginning of the year, but the regional differentiation of funds exactly reflects the structural resilience of gold allocation demand.
The gold price adjustment has not weakened the market trading enthusiasm. Transaction data tracked by CD Markets show that the global gold market's average daily trading volume in the first half of the year reached 488 billion U.S. dollars, setting a record high half-year average. Among them, the OTC market and the exchange market's daily average trading volume both hit a record high for the same period in history. The average daily trading volume of gold ETFs reached 12 billion U.S. dollars, an increase of 73% year-on-year. Mainly driven by active trading in the U.S. market. Even though overall market trading cooled down in June, gold ETFs remained the only sector to buck the trend, with average daily trading volume increasing 23% to $6.9 billion, showing that investors' interest in gold trading remains strong.
The differentiation of the position structure deserves more attention. CD Markets analyzed CFTC position data and found that in June, COMEX gold net long positions bucked the trend and increased by 16% to 538 tons, the highest level since January this year. However, the internal structure showed obvious differentiation: the net long positions of non-reported positions representing retail investors declined, while the net long positions of other reported positions representing large institutional investors increased by 16%. From the perspective of the entire first half of the year, the overall net long position of managed funds has only decreased by 43 tons, and the overall position has remained stable. Especially since mid-March, the positions of large institutions have basically remained stable, reflecting that institutions’ long-term allocation demand for gold has not been significantly weakened by short-term price corrections, and retail investors are more following short-term price fluctuations.
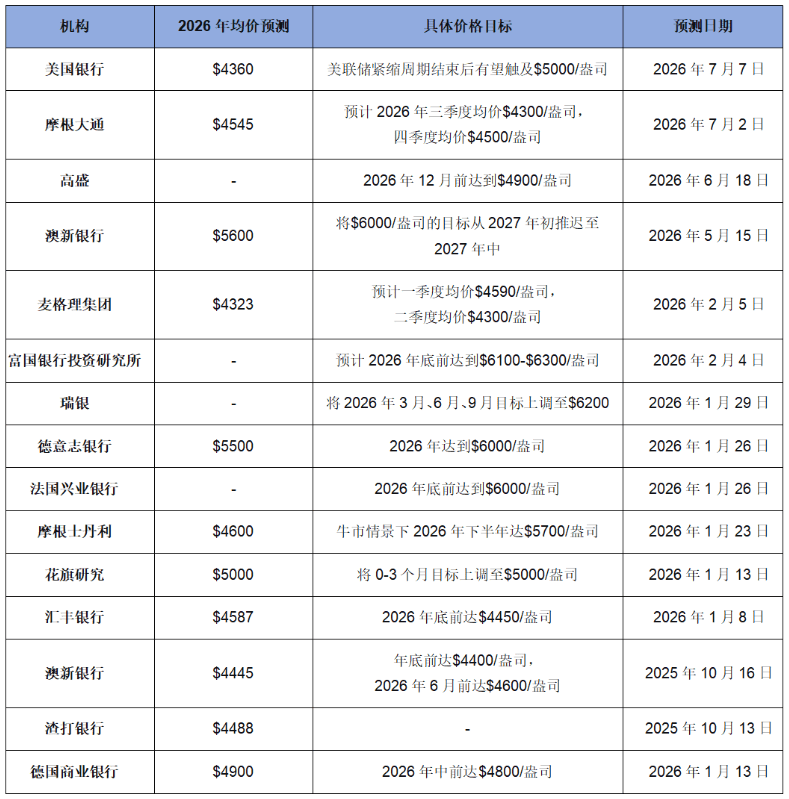
Recently, mainstream institutions have lowered their short-term gold price expectations, further confirming the pressure on the short-term market. The latest forecast from the CD Markets cross-validation agency found that the Bank of America lowered its average gold price forecast by 14% to $4,360 in 2026. The core reason is that the Federal Reserve’s policy stance has shifted to a more hawkish stance; JPMorgan Chase has made similar adjustments before, suggesting the downside risk to gold prices caused by the Federal Reserve’s possible early interest rate hike. However, all institutions have not changed their long-term bullish stance. Bank of America has made it clear that once the Fed's tightening cycle ends, gold prices still have a chance to rise to $5,000 per ounce. JPMorgan Chase also maintains its long-term bullish view in 2027. The latest minutes of the Federal Reserve's June meeting show that some officials believe that it is necessary to raise interest rates in June, and the final choice to stay on hold is a prudent decision. Officials' concerns about inflation continue to increase, while concerns about the labor market have subsided. The expectation that high interest rates will remain high for a longer period of time is still suppressing the performance of gold.
CD Markets' comprehensive analysis believes that gold will still face relatively clear headwinds in the short term. The Fed's hawkish policy expectations, the strengthening of the U.S. dollar, and the repeated risks of inflation brought about by the situation in the Middle East will continue to suppress the performance of gold prices, and the market is still in the stage of shock and bottoming. However, from a longer-term perspective, the core logic supporting gold has not fundamentally changed. Geopolitical risks, the global de-dollarization trend, the central bank’s continued demand for gold purchases, and the financial debt pressure of various countries will still provide long-term upward momentum for gold. The current differentiation of funds just shows that while short-term speculative funds are withdrawing, long-term allocation funds are gradually entering the market. The correction in gold prices has provided medium and long-term investors with a better layout window. Investors can pay close attention to changes in the Federal Reserve's policy signals and inflation data, and grasp the rhythm of batch layout.

 English
  Chinese
  Vietnamese
  Hindi
Hindi  Japanese
  Thai
Thai  Korean